
By Evan Coffey & Kate Templeton
Consider an investor who did what the textbook asks and took diversification seriously. He or she owns large companies and small ones, American stocks and foreign stocks, and fixed income as a traditional ballast. The client’s portfolio has grown at a pace that would have satisfied them in almost any other period. Yet even still, they open up their account statement and feel behind.
The feeling is real, and it deserves a better question than the one it usually gets. The usual question is why the portfolio lagged. The more useful question is what it lagged.
For most investors, the answer is the S&P 500, a benchmark so familiar that it is rarely examined. It’s treated as a stand for the market itself, a neutral and diversified yardstick. That description, which was rather fitting for most of the index’s history, is quite poor in today’s market environment. The distance between what the index has become and what it’s assumed to be explains much of the frustration that diversified investors feel.
The Index is Not What it Used to Be
For four decades, the ten largest companies in the S&P 500 held about a fifth of the index. Their combined weight was 21% at the start of 1985, 18% in 1995, 21% in 2005, and 18% in 2015. By the start of 2025, it had ballooned to 39%. At the end of September, it stood at 40.6%, and those ten companies were worth $26.8 trillion, against $3.2 trillion for the top ten of 2015.
The list has narrowed as much as the weights have grown. In 2015, the top ten held Apple and Microsoft alongside Exxon, GE, Johnson & Johnson, Wells Fargo, Berkshire Hathaway, Proctor & Gamble, JPMorgan, and Chevron, a mix of energy, banking, health care, industrial, and consumer staples. Today, every name is a technology or technology-adjacent company, and four of the ten make semiconductors. Berkshire Hathaway and JPMorgan, the last two names from outside the tech world, dropped off after the latest semiconductor run with Micron and AMD taking their places.
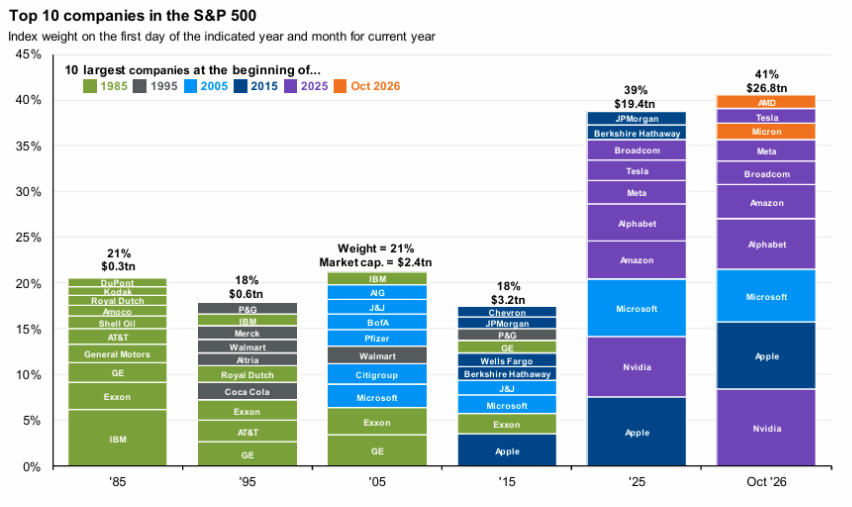
The three largest names alone account for over a fifth of the index. In the equal weight version of the same index, it takes 97 positions to reach that share.
The clearest way to see what this has done to returns is to hold the same 500 companies two ways. One version weights them by size, as the index does. The other gives every company the same weight. Over the three years through early October, the equal weight version trailed by roughly 16%. A gap that wide has appeared in only about 2% of three-year periods since 1929. Over five years, the gap widens to about 21%.
What makes this stretch particularly unusual is that the average stock has not done poorly. The equal weight index returned between 11% and 14% in each of the last three calendar years. That’s quality performance by almost any historical standard. Where the number starts to look more bleak is when it’s set beside an index carried by a small number of its largest members.
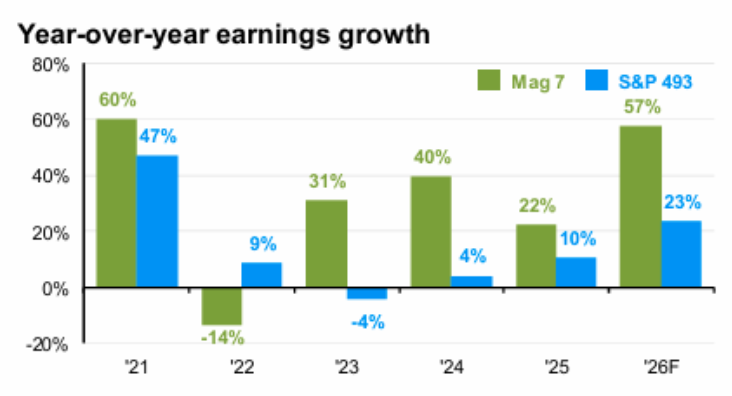
It would be too easy to call this a mania and move on. Tons of people have written about market concentration over the past three years, but rarely do they give credit where credit is due. The largest companies in the S&P 500 have earned their weight. In 2025, the top ten names produced about a third of the index’s earnings, against a roughly 41% weight. Price has run ahead of profits, but the profits are tangible. Earnings of the Magnificent Seven grew 31% in 2023, 40% in 2024, and 22% in 2025. Earnings for the other 493 companies fell 4% in 2023, then grew 4% and 10% in the ensuing two years. Analysts expect 57% against 23% for full-year 2026. Investors are paying a premium and they are paying it for businesses that have delivered.
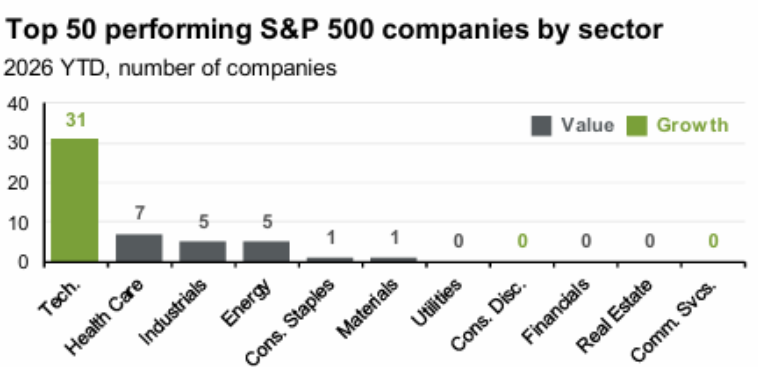
The same arithmetic reaches well beyond the equal weight comparison. Any portfolio that owns less of those ten companies than the index is being measured against a bet it chose not to make in full. That pertains to small and mid-cap stocks, international stocks, value strategies, and any balanced portfolios that hold other asset classes like bonds. It also describes any portfolio spread across sectors. Of the 50 best performing stocks in the index this year, 31 are tech companies and five of the eleven sectors have none. Their shortfalls look like separate disappointments, but in reality, the performance gap traces back to the same single source.
None of this makes the S&P 500 a poor investment. It makes it a different investment than its reputation suggests. A dollar placed in the index today puts close to 40 cents into ten companies, most of them tied to the same technological cycle. That is a concentrated position in growth and technology carrying a diversified label, and it is the barometer against which nearly every portfolio is judged.
Why the Gap Feels like Failure
Nobody is arguing with the index. The frustration that investors are feeling comes down to whether it’s a fair comparison. This is a version of reference dependence. People judge an outcome against a reference point rather than evaluating the outcome on its own. For most investors, the index is that reference point, not because it necessarily matches their goals or risk tolerance, but simply out of habit.
A portfolio that returns 11 to 14 percent for three years straight is a metric that would leave many investors satisfied. Compare that to the index, and that portfolio trailed by nearly 16 percent over the same timeframe. That doesn’t sound as favorable when you look at it like that. But the portfolio didn’t do anything wrong. It just happened to be measured against ten companies having a historic run. That is reference dependence, or framing, at its core. The number stayed the same, but the frame around it did not.
Reference dependence has a clear explanation. Pointing out that the benchmark does not match a client’s goals or risk tolerance from the outset can partially ease the discomfort. What is harder to shake is the sense that they should have done something differently. That lingering sense, call it regret aversion, is not just about chasing the best return. It is about avoiding the pain of a missed opportunity. After a stretch like these past few years, ‘I should have owned more of them,’ feels justified. As mentioned prior, the ten biggest names earned roughly a third of the index’s profits on a 41 percent weight. It’s hard to chalk it up to FOMO when the earnings are real. That regret over what was not owned is what drives an investor to concentrate late, right when the cost of being wrong is highest. At that point, adding more to those ten companies is no longer about diversification. It is an effort to avoid that feeling of regret, even if it means the portfolio ends up looking a lot like the index it was supposed to be different from.
Many investors do not act on regret alone. They need justification that sounds sensible. After three years of the same leaders winning, it’s easy to believe that this is simply the new norm and where returns are now coming from. Recency bias makes a trend that developed over a short time period feel permanent. For a majority of the last 40 years, the largest companies occupied about a fifth of the index. Three years is a short window to change the entire narrative, but long enough for investors to stop questioning it. A good return starts to feel like a failure because of the benchmark. That turns into regret over what was not owned. A few strong years push investors toward a decision they would not have made at the start.
Choose Your Target
Before changing a portfolio, examine the reasoning behind its benchmark. The index is the easiest reference point, but the right one is built around what the portfolio is meant to do. Start by defining what success looks like for the portfolio, then measure against a benchmark that matches.
Choosing the right benchmark does not change the fact that diversification has been costly these past few years. Its value shows up when something unexpected happens, such as a war in the Middle East or the implementation of widespread tariffs. Still, being diversified is not a prediction that events like these will occur. That’s especially hard to remember when the cost is visible, and the biases that make it harder are well known. Awareness of these biases is useful, but they are difficult to overcome. Even when investors recognize them, the urge to chase what has been winning does not go away. Chasing the winners requires counting on the same companies to keep winning. Each investor should decide whether they want their plan to depend on that.
Kate Templeton | Associate, Asset Management
Kate is an Associate on GVA’s Asset Management Team, where she specializes in operations, advisor communication, and strategic account analysis. Kate’s strong analytical thinking and close attention to detail drive her success in streamlining workflows and generating data-driven insights that enhance reporting quality and operational performance.
In 2024, Kate graduated summa cum laude from Ursinus College with a BA in Applied Economics and minors in Management Studies and Psychology. During her time at Ursinus, Kate was a member of the Ursinus College Investment Management Company and the Omicron Delta Epsilon and Psi Chi honor societies. She also served as vice president and social media coordinator for her sorority, Phi Alpha Psi.
Outside of work, Kate enjoys going to the beach, doing pilates, spending time with friends and family, and keeping up with reality TV.
Evan Coffey | Investment Analyst, Asset Management
Evan is an Investment Analyst on GVA’s Asset Management Team. He specializes in investment research and has a passion for finance and economics. Evan uses his strong work ethic and financial literacy to help manage GVA’s multi-asset portfolios, mitigate risk, and help coordinate wholesaler relationships. In the Spring of 2024, Evan graduated as valedictorian from Ursinus College with a BA in Finance and a minor in Management Studies. Evan took part in Finance Scholars and was a CEO of the Ursinus College Investment Management Company. Evan was also inducted into Phi Beta Kappa and Omicron Delta Epsilon during his time at Ursinus. Outside of his coursework, Evan was captain of the men’s golf team and worked on a year-long honors project focusing on the stock-bond correlation and how macroeconomic variables affect the relationship between the two asset classes.
Prior to joining GVA full-time, Evan interned with GVA’s Asset Management team! During his time as an intern he focused on equity research, and shadowing wholesaler and advisor meetings. Under the guidance of the GVAAM team, Evan gained quality professional experience in the finance and asset management industry. Outside of Finance and Economics, Evan enjoys golfing, watching Formula 1 racing, going to Sixers games, and traveling with close friends and family.
Disclosure: I/we have no stock, option, or similar derivative position in any of the companies mentioned, and no plans to initiate any such positions within the next 72 hours. I wrote this article myself, and it expresses my own opinions. I am not receiving compensation for it. I have no business relationship with any company whose stock is mentioned in this article.
Investment advice offered through Great Valley Advisor Group (GVA), a Registered Investment Advisor. I am solely an investment advisor representative of Great Valley Advisor Group, and not affiliated with LPL Financial. Any opinions or views expressed by me are not those of LPL Financial. This is not intended to be used as tax or legal advice. All performance referenced is historical and is no guarantee of future results. All indices are unmanaged and may not be invested into directly. Please consult a tax or legal professional for specific information and advice. LPL Compliance Tracking #1191071
The economic forecasts set forth in this material may not develop as predicted and there can be no guarantee that strategies promoted will be successful. All investing involves risk including loss of principal. No strategy assures success or protects against loss.